

How to Check Mandi Bhav Online: The AGMARKNET Guide (and How to Read the Numbers)
Official mandi prices are free and public, published daily from APMC markets across India. Most farmers either never look, or look at the wrong number. Here is where the data comes from, how to read min, max and modal price, and why the highest figure is usually a trap.
Quick answer
Check today's mandi bhav on agmarknet.gov.in by selecting your commodity, state, market and date, or in an app reading the same official data. Plan with the modal price — the rate most lots actually traded at — not the maximum, which is usually one small premium lot. Every price carries the date the committee reported it.
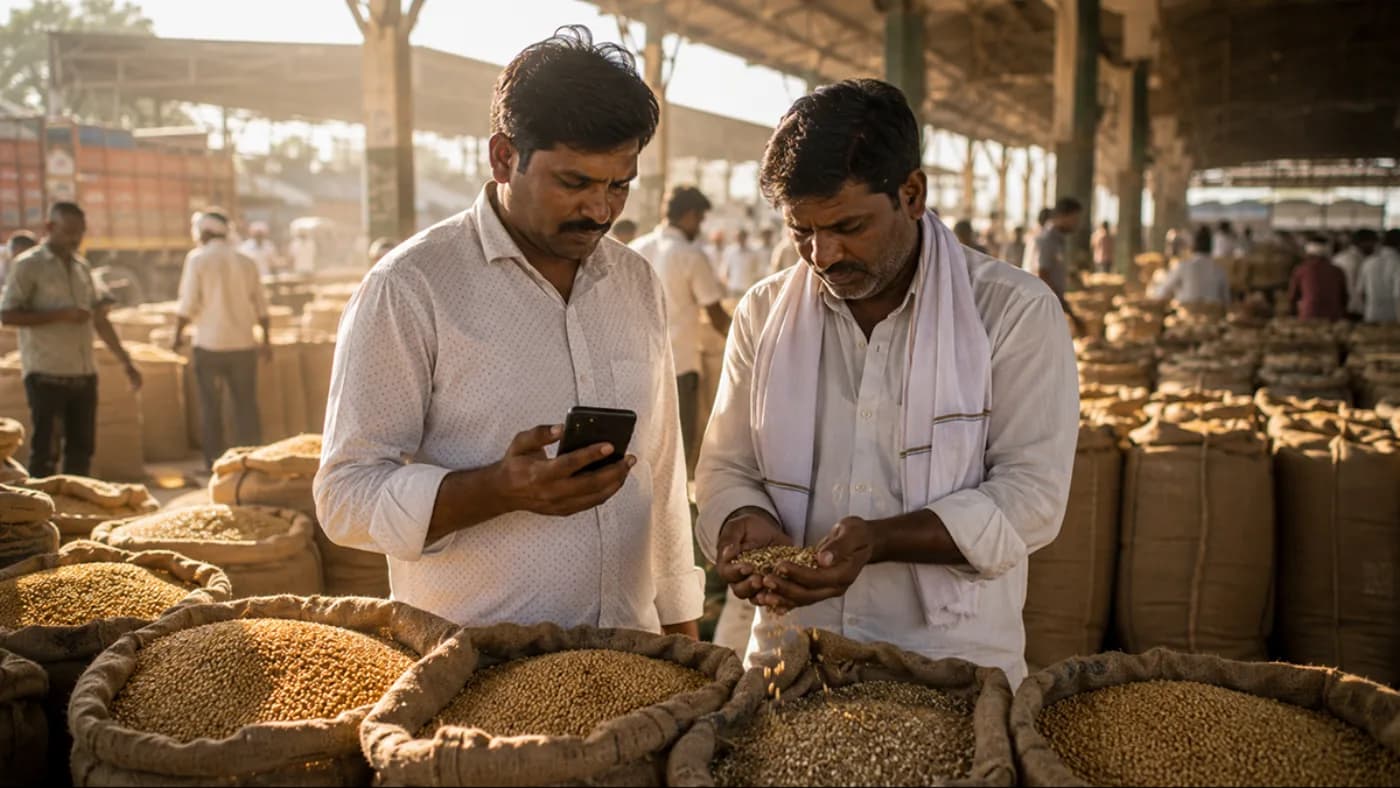
The price your crop fetches is the one number you have least control over — and the one most farmers walk into blind. Yet daily prices from hundreds of APMC markets are published free by the Government of India, and have been for years. The gap is not access; it is knowing which figure to read and how much weight to give it. Read the wrong column and you will drive to the wrong mandi.
What AGMARKNET actually is
AGMARKNET stands for Agricultural Marketing Information Network. It is the Government of India's official system for collecting and publishing agricultural market prices, run under the Directorate of Marketing and Inspection in the Ministry of Agriculture, and published at agmarknet.gov.in. The same data is also released through the Open Government Data Platform at data.gov.in under the GODL-India licence, which is how apps are able to show it to you legitimately.
The data originates with the market committees themselves. Each APMC records the arrivals and the prices at which lots actually traded that day, and reports them upward. That single fact explains most of AGMARKNET's strengths and every one of its weaknesses: the numbers are real transactions rather than estimates, but they arrive only as fast as each committee reports them.
It is worth separating AGMARKNET from e-NAM, because farmers conflate them constantly. AGMARKNET is price *information* — it tells you what things sold for. e-NAM is a trading *platform* where you can actually sell, with online bidding and payment. They complement each other, and our e-NAM guide covers the selling side in detail.
The three prices — and which one to actually use
For each commodity in each market on each day you will normally see three figures: minimum price, maximum price and modal price. Nearly every farmer's eye goes straight to the maximum, and that is the single most common mistake in reading mandi data.
The maximum is the highest price any lot fetched that day. That lot was very often small, exceptionally well graded, of a premium variety, or bought by a trader with a specific order to fill. It is real, but it is not available to you by default. Planning a sale around the maximum is how farmers end up disappointed at the gate after paying for transport.
The modal price is the one to plan with. Modal means the most frequently occurring price — the rate at which the bulk of that day's lots actually changed hands. It is the honest centre of the market. Use modal for your decisions, read maximum as an indication of what top grade can earn if you can genuinely reach it, and read minimum as a warning of what poorly graded or high-moisture produce gets cut to.
The spread between minimum and maximum is itself information. A wide spread means grading is being rewarded heavily that day, so cleaning and drying your lot properly is worth real money. A narrow spread means the market is treating everything much the same, and your effort is better spent on choosing a different mandi or a different week.
- Modal price — the most-traded rate. Plan with this one.
- Maximum — usually a small premium lot. Aspirational, not your baseline.
- Minimum — what poor grading or excess moisture gets you cut to.
- Wide min-to-max spread — grading is being paid for today; clean and dry the lot.
- Check arrivals too: heavy arrivals usually mean today's price is soft.
Why the date on the price matters so much
Reported prices carry a date because they are reports, not a live ticker. Committees submit with delays, some markets miss days, holidays create gaps, and figures are occasionally revised after the fact. A price stamped two days ago is still useful — it tells you the level and the direction — but it is not a quote you can hold anyone to.
This is exactly why any honest tool shows you the report date rather than dressing an older figure up as current. In Khetiyaar's Mandi Bhav, every price carries the day the mandi reported it, and when there is not enough history to draw a trend it says so rather than inventing a line. Treat any app that shows a bare number labelled "live" with suspicion — the underlying government data simply does not work that way.
The practical rule: use reported prices to choose where and roughly when to sell, then confirm the actual rate at the mandi on the day, before you load. No published figure survives contact with the gate.
Comparing mandis without losing the gain to transport
The reason to check prices across markets is that the difference between two nearby mandis regularly exceeds the cost of getting there — and almost nobody checks. But the comparison has to be done properly, net of costs, or you will chase a higher headline price and arrive poorer.
Work it out per quintal, not in total, because that is the unit the price is quoted in. Take the modal price difference between the two mandis, multiply by the quintals you are carrying, then subtract the extra transport, the extra labour for loading and unloading, any additional market fees, and the value of the extra day you spend. If what remains is thin, sell locally. Small loads almost never justify a long trip, because transport is close to fixed while the gain scales with volume.
Also weigh the things that do not appear in the arithmetic. A farther mandi may have more buyers and therefore better competition for your lot, or it may be a market where nobody knows you and you have less standing. A local buyer relationship has real value when you need flexibility on payment or timing.
Knowing your floor before you look at the ceiling
Checking prices is only half the job. A price is only good or bad relative to two numbers you should already know: your cost of production per quintal, and the Minimum Support Price for your crop where procurement applies.
Work out your cost first. The farming cost and profit calculator turns your inputs, labour and area into a cost per quintal and a break-even price, which changes the conversation at the gate entirely — a farmer who knows his break-even negotiates from fact, and a farmer who does not accepts whatever is offered. Then set the MSP alongside it: our MSP and mandi bhav guide for 2026-27 explains how the announced rates translate into what you are actually offered, and why registration windows decide whether MSP is available to you at all.
With those two numbers in hand, a mandi price stops being a mystery and becomes a decision: sell now, hold if you have safe storage, or register for procurement. Our guide on selling produce at a better price covers the grading and timing levers that move you up within whatever the market is paying.
A workable habit through the season
None of this needs a portal open on a laptop. Khetiyaar's Mandi Bhav pulls the same official AGMARKNET reports, suggests the crops already in your plan, compares the markets around you, estimates what you would net after travel at your own per-km cost, and shows MSP alongside — in Gujarati, Hindi or English, with the report date on every figure.
- Check the modal price for your crop weekly from about a month before harvest, so you learn the direction rather than reacting to one day.
- Track two or three mandis, not one. A single market tells you nothing about whether today's rate is good.
- Note the arrivals alongside the price — the two together explain why the rate moved.
- Set a price alert so a good day does not pass while you are busy in the field.
- Confirm at the mandi on the day before you load. Always.
Frequently asked
What is the full form of AGMARKNET?+
Agricultural Marketing Information Network. It is the Government of India's official agricultural market price system, run under the Directorate of Marketing and Inspection in the Ministry of Agriculture, published at agmarknet.gov.in and also released through data.gov.in under the GODL-India licence.
How do I check today's mandi bhav online?+
You can look it up on agmarknet.gov.in by selecting your commodity, state, market and date, or use an app that reads the same official data. Khetiyaar's Mandi Bhav suggests the crops already in your plan, compares nearby markets, and stamps every price with the day the mandi reported it.
What is the difference between minimum, maximum and modal price?+
Minimum is the lowest price any lot fetched, maximum the highest, and modal the most frequently occurring — the rate at which the bulk of lots actually traded. Plan with the modal price. The maximum is usually a small, exceptionally well graded or premium-variety lot and is not a realistic baseline.
Why is the mandi price shown from yesterday and not today?+
Because prices are reports from market committees, not a live feed. Committees submit with delays, some markets miss days, and figures are occasionally revised. A dated price still tells you the level and direction, but always confirm the actual rate at the mandi before you travel or sell.
Is AGMARKNET the same as e-NAM?+
No. AGMARKNET is price information — it publishes what commodities sold for across markets. e-NAM is a trading platform where produce is actually sold, with online bidding and payment. They serve different jobs and work well together.
Is checking mandi prices free?+
Yes. AGMARKNET data is published free by the Government of India and released under the GODL-India open licence, which is why apps can show it. You should never pay for access to mandi price data itself.
Where to go next
- Today's mandi bhavOfficial AGMARKNET rates for your crop, nearby mandis compared, and the net price after travel.
- Farming cost & profit calculatorWork out cost per acre, break-even yield and expected profit before you sow.
- Agri Bazar marketplaceBuy and sell animals, crops, equipment and dairy near you — and see what buyers want today.
Want this as daily tasks for your farm?
Khetiyaar turns guides like this into a day-by-day plan — in your language, free to start.

Related guides
MSP 2026-27 and Mandi Bhav: What the Announced Rate Really Means at the Gate
Groundnut MSP for 2026-27 is ₹7,517 a quintal and long-staple cotton ₹8,667. Very few farmers actually receive those numbers. This guide explains the gap between the announced MSP and your gate price — and the four levers that close it.

How to Sell Your Farm Produce and Get a Better Price
The difference between a good year and a poor one is often not how much you grow, but the price you get. Selling smarter adds more than any input.
Onion Storage and Price Volatility: A Farmer's Guide to Selling Smarter
Onion prices swing harder than almost any other crop in Indian markets — good curing and storage is often worth more to your final income than the harvest itself.